DMR 909 chr2:42786551-42786750 (200bp)
| DMR Stats | |
|---|---|
| Position | chr2:42786551-42786750 (View on UCSC) |
| Width | 200bp |
| Genomic Context | intron |
| Nearest Genes | MTA3 (0bp away) |
| ANODEV p-value | 0.00373510402179 |
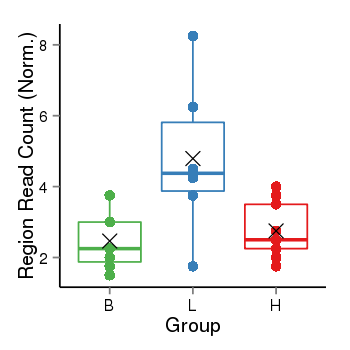
| Frequencies | Benign: 1.0 (14.29%), Low: 5.0 (83.33%), High: 3.0 (33.33 %) |
| Frequent? |
Region Count Boxplot
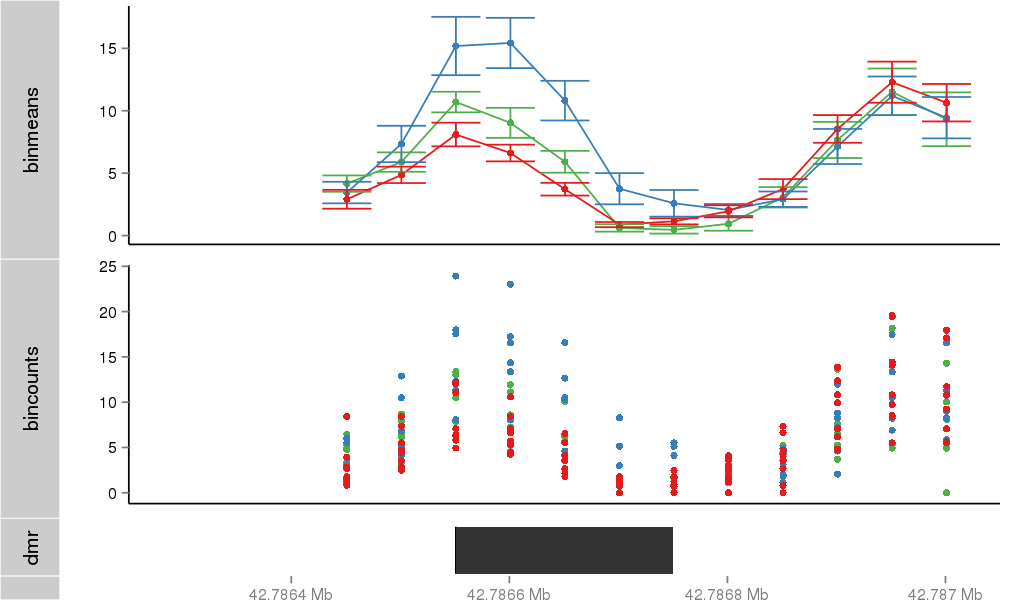
Region Overview
Gene Overlaps
| Dmrid | Gene Symbol | Gene Id | Isoform Id | Isoform Chr | Isoform Start | Isoform End | Isoform Strand | Overlap Bp | Query Overlap Per | Isoform Overlap Per | Noncoding | Promoter Per | Exonintron Per | End Per |
|---|---|---|---|---|---|---|---|---|---|---|---|---|---|---|
| 909 | MTA3 | 16272 | uc002rso.1 | chr2 | 42721709 | 42984086 | + | 200 | 100.0 | 0.59 | 0 | 0.0 | E1 (0), I1 (0), E2 (0), I2 (100), E3 (0), I3 (0), E4 (0), I4 (0), E5 (0), I5 (0), E6 (0), I6 (0), E7 (0), I7 (0), E8 (0), I8 (0), E9 (0), I9 (0), E10 (0), I10 (0), E11 (0), I11 (0), E12 (0), I12 (0), E13 (0), I13 (0), E14 (0), I14 (0), E15 (0), I15 (0), E16 (0), I16 (0), E17 (0), I17 (0), E18 (0) | 0.0 |
- 1 genes
Feature Overlaps
Omics Overlaps
| Dmrid | Omic Set | Data | Plot |
|---|---|---|---|
| 909 | cellmeth_recounts | PrEC: 9, LNCaP: 1, DU145: 20 | 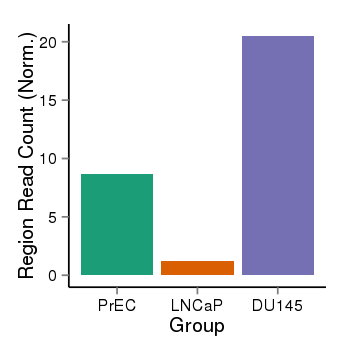 |
| 909 | cellmeth_diffreps_PrECvsLNCaP | A=12, B=0, Length=220, Event=Down, log2FC=-Inf, padj=0.00157949948552458 | 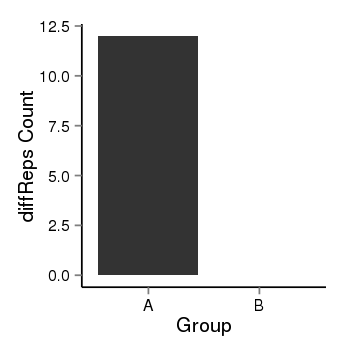 |
| 909 | cellmeth_diffreps_PrECvsDU145 | A=0, B=12, Length=200, Event=Up, log2FC=Inf, padj=0.00174045876043459 | 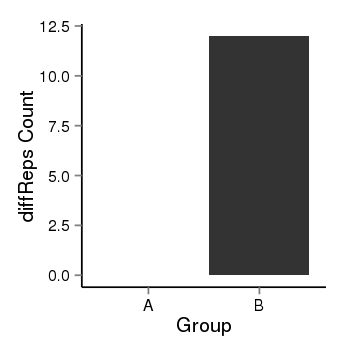 |
| 909 | cellmeth_diffreps_LNCaPvsDU145 | A=0, B=13.1, Length=200, Event=Up, log2FC=Inf, padj=0.00251303816158297 | 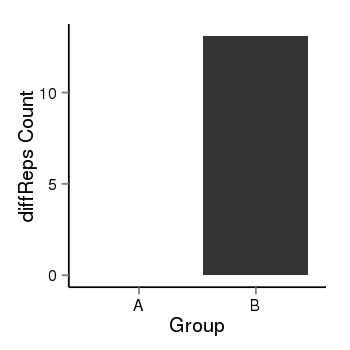 |
| 909 | cellexp | id=ENSG00000057935, name=MTA3, PrEC=1914, str=2166, LNCaP=2417, str=2461, DU145=3228, str=3136 | 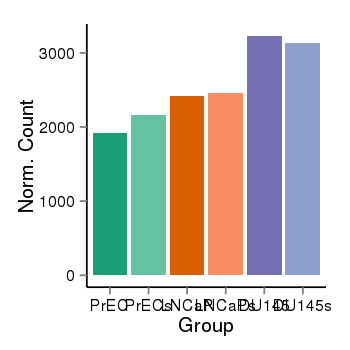 |
| 909 | tcgaexp | gene=MTA3, entrez=57504, pos=chr2:42721709-42984086(+), B=2554, L=2472, M=2334, H=2405 | 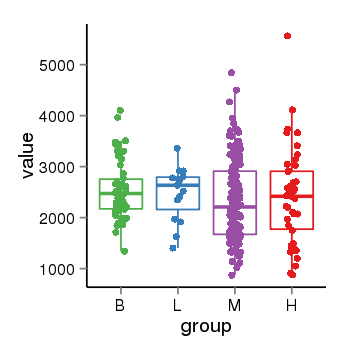 |